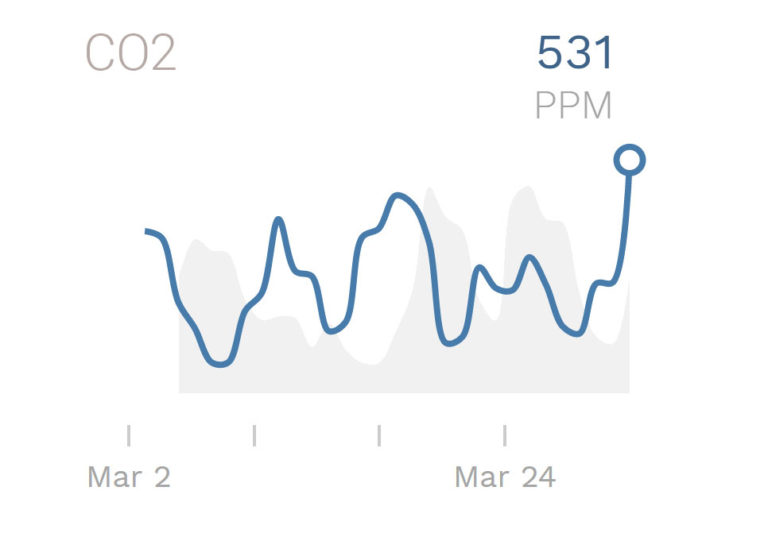
CO₂ is measured in ppm (parts per million). CO₂ indoors is a colorless, odorless gas, produced by human breath. Normal CO₂ levels are 600-800 ppm (parts per million) depending how many people are in the space and how well air is ventilated.
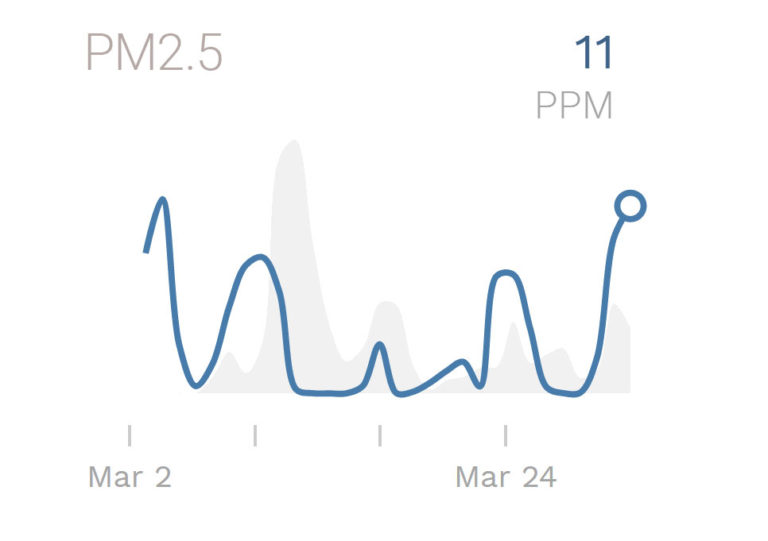
Particulate Matter (PM)
Affects Allergies & Respiratory Disease
PM1 – 2.5 – 10 are measured in μg/m3 (micrograms per cubic meter). Particulate Matter is a complex mixture of solid and/or liquid particles suspended in air, measured in micrograms/cubic meter. Large particles (PM10) up to 10 microns are one tenth of the width of a human hair.
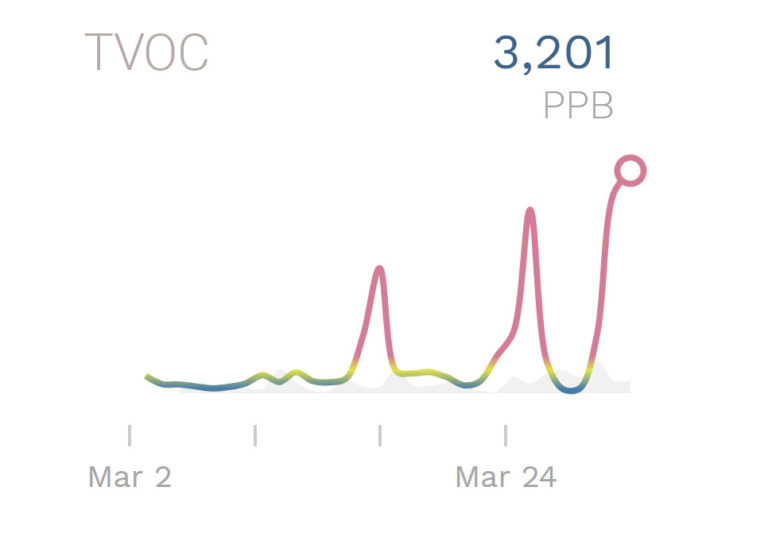
Volatile Organic Compounds (VOCs)
Impacts Eye, Nose, Throat Irritation & Cancer
VOCs are measured in parts per billion (ppb). VOCs include a broad range of gases from certain solids or liquids; including a variety of chemicals with varying levels of toxicity.
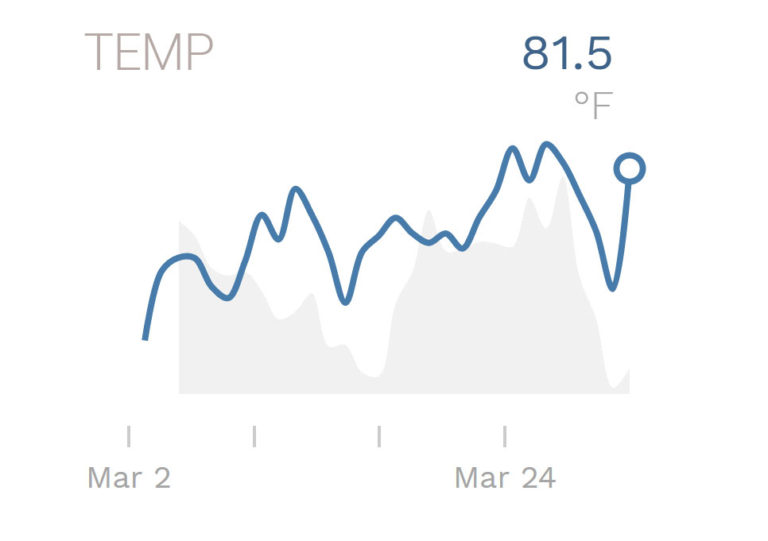
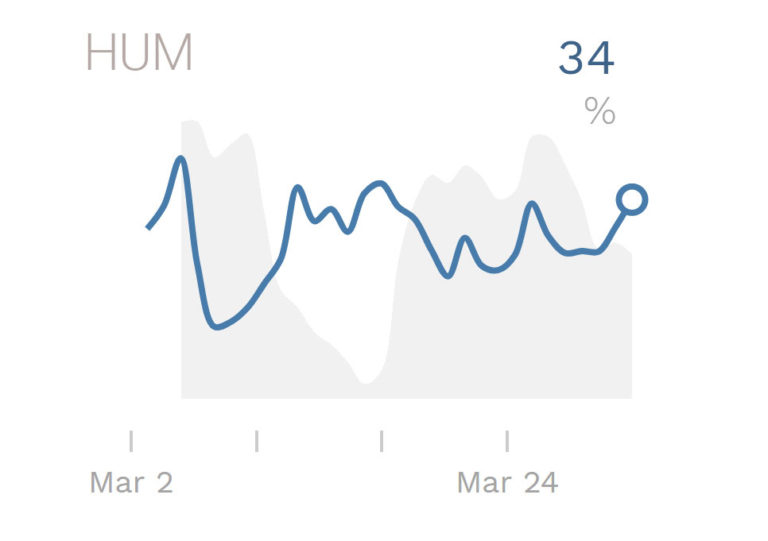
Temperature & Relative Humidity
Affects Comfort & Conditions for Mold & Viral Particulates
Temperature and relative humidity together are a good measure of levels of human comfort. Sensitivity to temperature increases with higher humidity levels.
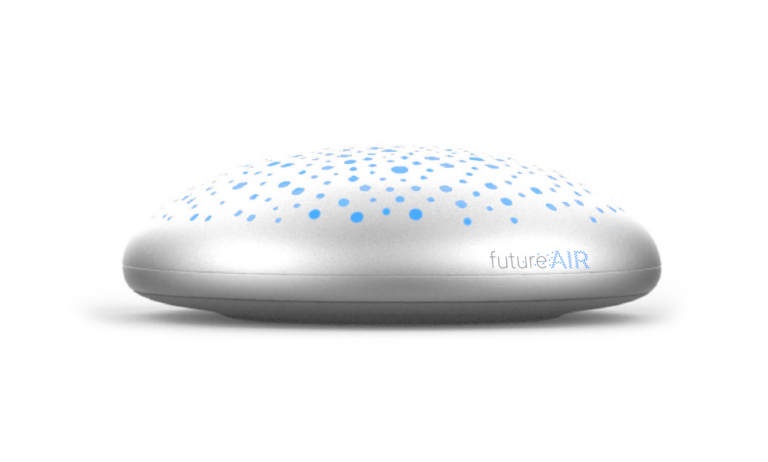
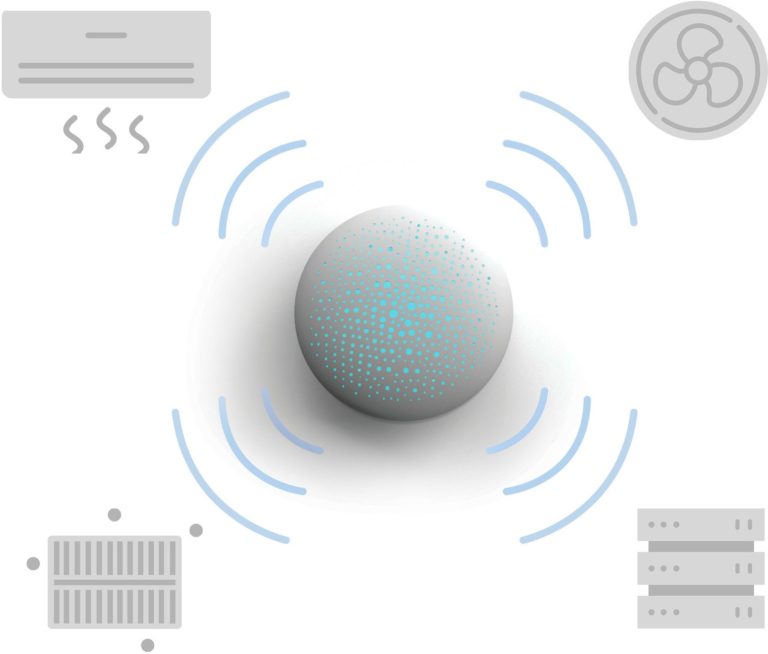
A beacon for smart, healthy, energy-efficient air.
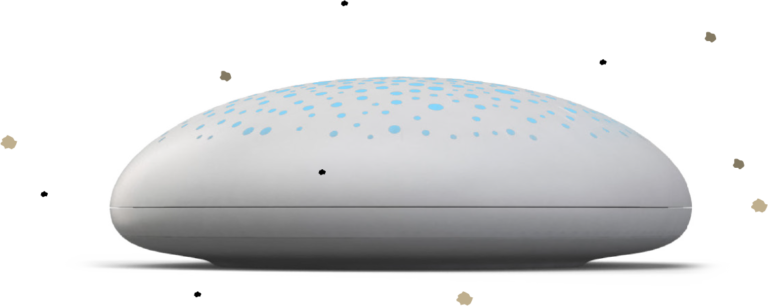
Senses & Measures
Measures levels of indoor air pollutants(CO₂, PM, VOCs); temperature and humidity.
Collects & Analyzes
Collects high resolution data and analyzes quality of air based on international thresholds.
Predicts & Initiates Solution
Activates machine learning to recognize and predict trends to solve problems before they occur.
Acts & Improves Air
Connects with building management systems (BMS), connected air filters,, purifiers, humidifiers to improve air.
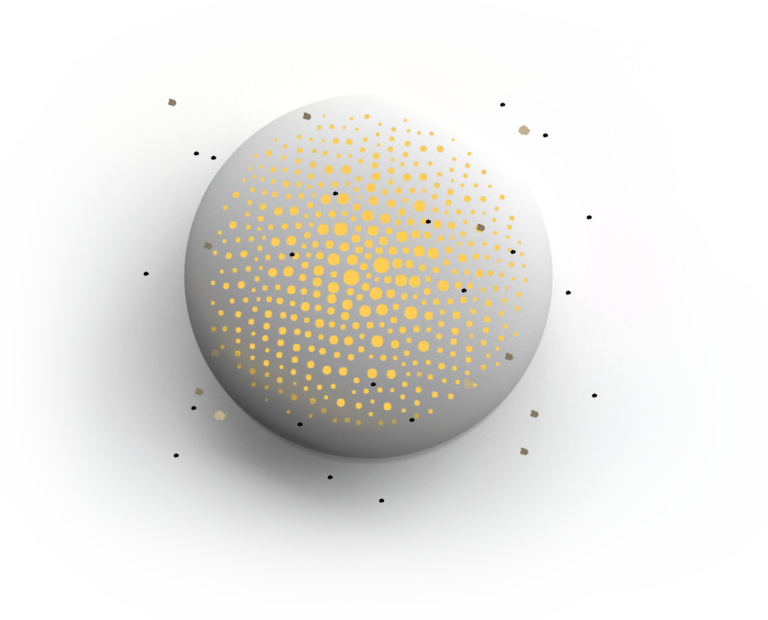
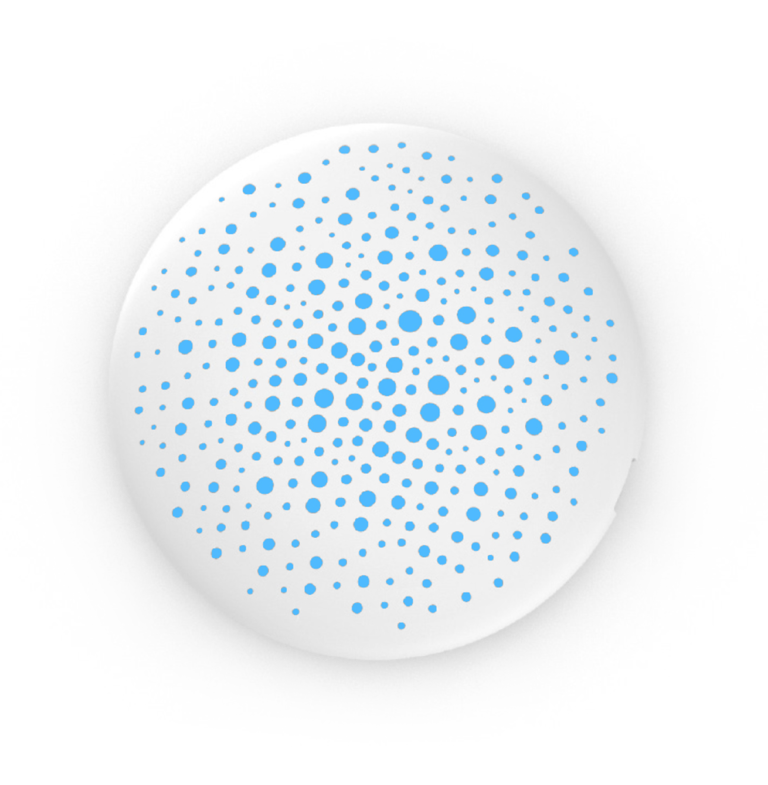
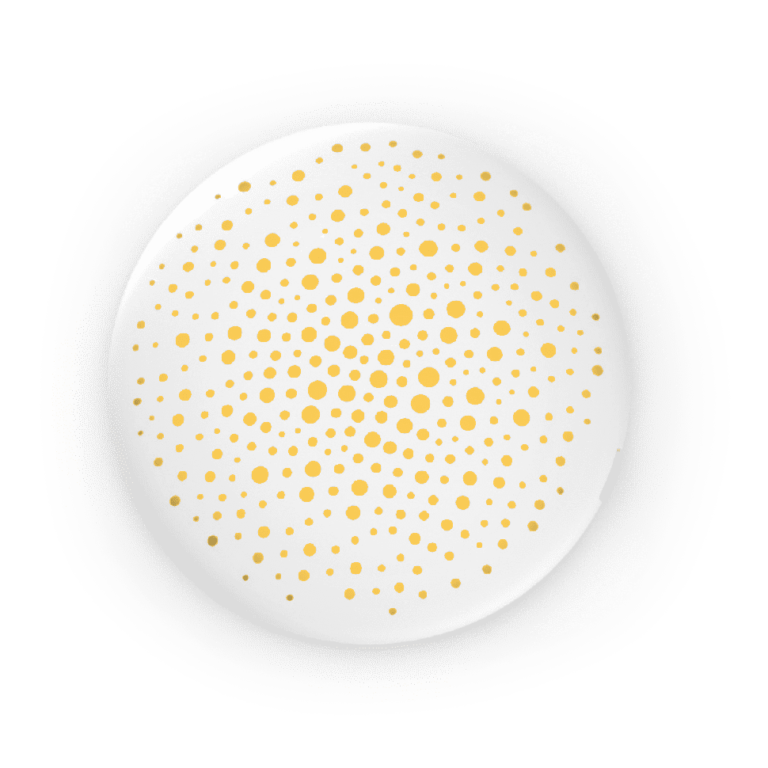
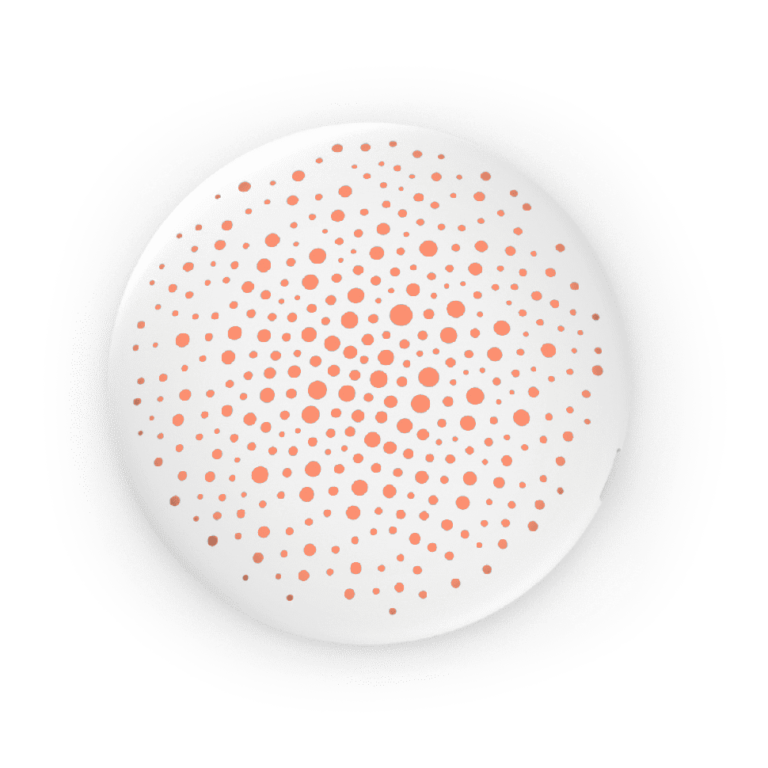
Intuitive color system
good levels air quality
moderate levels air quality
unhealthy levels air quality
Real time data, insight, and analytics, accessible anywhere.
View data by hour, day, week or month(s) on FutureAir’s live dashboard with access to raw data for the more granular data. SAM™ detects patterns over periods of time (minutes, hours, days, months) to identify and solve indoor air quality problems.